At Infinite, we love networking and the ability to nerd out on the data. Back in October 2024, we published our first look at observed G.fast sync speeds across the Vision Network in Canberra and this is a follow up with what we found.
That initial snapshot gave us a promising early picture but it was drawn from a smaller sample. Since then, we’ve collected a significantly larger dataset spanning 57 Canberra suburbs and a much wider range of drop lengths, from 5 metres right out to 321 metres. This expanded view gives a far more complete picture of what G.fast actually delivers across the city and helps answer the question every potential customer asks: what speed can I expect at my address?
A note on this data: This dataset only includes customers whose connections achieved G.fast sync speeds. Customers who could not achieve G.fast speeds (for example, due to excessive drop lengths or copper quality issues) have not been included, which would affect these numbers and should be considered when reading the results below.
The Big Picture
Across all observed G.fast connections, the average downstream sync speed is 694 Mbps, with a median of 665 Mbps. Average upstream sync sits at 90 Mbps, with a median of 100 Mbps.
Those figures closely match the 686/97 Mbps averages we reported in our original 2024 article, providing reassuring confirmation that G.fast performance across the Vision Network is consistent and holding strong as the service matures. The slightly higher average in this expanded dataset reflects the larger, more representative sample now available.
The results are genuinely impressive. Almost two-thirds of all connections (64.1%) sync above 500 Mbps and nearly one in four (24.3%) sync above 1,000 Mbps. Virtually every G.fast connection we observed (98.3%) exceeds 250 Mbps downstream and every single one exceeds 100 Mbps.
Here’s how the full speed distribution breaks down:
| Speed Range | Share of Connections |
|---|---|
| 1,000 Mbps and above | 24.3% |
| 750–999 Mbps | 18.7% |
| 500–749 Mbps | 21.2% |
| 250–499 Mbps | 34.1% |
| Under 250 Mbps | 1.7% |
To put that in context: the most popular nbn plan in Australia is the 50 Mbps tier. The median G.fast sync speed we observe (665 Mbps) is more than thirteen times faster. Even the lowest-performing G.fast connections in our dataset comfortably outperform nbn 100 plans.
Which Suburbs Get the Best Speeds?
One of the most common questions we hear is: how fast will G.fast be in my suburb? The answer depends heavily on the length of the copper drop from the nearest Vision Network node to your premises but suburb-level averages give a useful indication of what to expect.
Top 15 Suburbs by Average Downstream Sync
| Suburb | Avg Down | Avg Up | Avg Drop Length |
|---|---|---|---|
| Canberra City | 978 Mbps | 107 Mbps | 61m |
| Kingston | 978 Mbps | 108 Mbps | 60m |
| Belconnen | 937 Mbps | 105 Mbps | 97m |
| Greenway | 930 Mbps | 104 Mbps | 88m |
| Chifley | 915 Mbps | 107 Mbps | 102m |
| Weston | 876 Mbps | 108 Mbps | 115m |
| Phillip | 849 Mbps | 95 Mbps | 53m |
| Dickson | 823 Mbps | 105 Mbps | 142m |
| Barton | 807 Mbps | 91 Mbps | 105m |
| Bruce | 797 Mbps | 98 Mbps | 67m |
| Braddon | 784 Mbps | 92 Mbps | 62m |
| Forrest | 777 Mbps | 95 Mbps | 104m |
| Giralang | 768 Mbps | 95 Mbps | 154m |
| Watson | 764 Mbps | 94 Mbps | 146m |
| Red Hill | 752 Mbps | 96 Mbps | 127m |
The pattern is clear: suburbs with shorter average drop lengths tend to deliver the highest speeds. Our observation is that many of the top-performing suburbs, such as Canberra City, Kingston, Belconnen, Phillip and Braddon, have a high proportion of multi-dwelling units where the Vision Network node is installed inside the building itself. This translates directly to very short cable drop lengths and, as a result, near-gigabit sync speeds. That said, it is not just the inner suburbs benefiting. Giralang and Watson in the outer north deliver averages above 750 Mbps even with moderate drop lengths and Weston in the west averages 876 Mbps with every single observed connection syncing above 500 Mbps.
Where Are Gigabit Speeds Most Likely?
If you’re chasing the fastest possible connection, it helps to know where gigabit sync speeds are most commonly observed. The suburbs with the highest proportion of connections syncing above 1,000 Mbps are:
| Suburb | % Above 1,000 Mbps | % Above 500 Mbps |
|---|---|---|
| Canberra City | 77% | 85% |
| Phillip | 67% | 67% |
| Kingston | 65% | 94% |
| Greenway | 56% | 78% |
| Belconnen | 54% | 85% |
| Barton | 50% | 75% |
| Chifley | 44% | 89% |
| Weston | 43% | 100% |
| Braddon | 42% | 67% |
| Forrest | 40% | 80% |
In Canberra City, over three in four observed connections sync above 1,000 Mbps. Kingston isn’t far behind at 65%. Even in suburbs further from the city centre like Chifley and Weston, between four and five connections out of every ten achieve gigabit sync.
Weston deserves a special mention: while its gigabit rate is 43%, every single observed connection there syncs above 500 Mbps, the only suburb in our dataset where that’s the case.
Drop Length: The Single Biggest Factor
As we discussed in our original article, the length of the copper cable between the Vision Network node and your premises (the “drop length”) is far and away the biggest determinant of your sync speed. Our expanded dataset confirms and sharpens that picture.
| Drop Length | Avg Downstream | Avg Upstream |
|---|---|---|
| 0–50m | 935 Mbps | 103 Mbps |
| 51–100m | 962 Mbps | 106 Mbps |
| 101–150m | 766 Mbps | 103 Mbps |
| 151–200m | 594 Mbps | 88 Mbps |
| 201–250m | 421 Mbps | 65 Mbps |
| 251–300m | 324 Mbps | 51 Mbps |
| 301m+ | 297 Mbps | 48 Mbps |
The sweet spot is clearly under 100 metres, where average downstream speeds approach or exceed 950 Mbps and many connections hit the sync ceiling around 1,168 Mbps. Performance remains strong out to about 150 metres, then drops off more steeply beyond 200 metres.
An interesting finding: the 51–100m bracket slightly outperforms the 0–50m bracket on average. This likely reflects other variables at play. Internal wiring quality, NTU installation and environmental factors can all influence sync speed and at very short distances these factors become proportionally more significant than the copper length itself.
Beyond 200 metres, speeds settle into the 300–420 Mbps range, still well above what nbn FTTC or FTTN delivers but noticeably below the technology’s peak. Even at the longest drops in our dataset (300m+), G.fast still averages close to 300 Mbps.
A Practical Guide to Setting Expectations
Based on the data, here’s a rough guide to what you can expect depending on your drop length:
-
- Under 100m – Expect near-gigabit sync speeds. Many connections in this range hit 1,000 Mbps or above. This is G.fast at its best.
-
- 100–150m – Expect strong performance in the 700–850 Mbps range. Still significantly faster than most nbn plans.
-
- 150–200m – Expect 500–650 Mbps. Comparable to or better than nbn 500 tier plans on FTTP.
-
- 200–250m – Expect 350–450 Mbps. Comfortable for multi-device households and working from home.
-
- 250m+ – Expect 250–350 Mbps. Still solid broadband that outperforms most nbn connections in Australia.
Your actual drop length is something we can check before you sign up. Just get in touch and we can look up your address.
The Upload Speed Story
Upload speeds don’t get the same attention as download but they matter, especially for video calls, cloud backups, uploading large files and working from home.
Our observed average upload sync of 90 Mbps (median 100 Mbps) is worth putting in context. The nbn 500 Mbps FTTP plans, launched in September 2025, offer just 50 Mbps upload. G.fast’s average upload nearly doubles what most Australians can get even on nbn’s upgraded high-speed plans.
At short drop lengths (under 100m), upload speeds consistently reach the 115 Mbps cap, the maximum the current G.fast profile supports. Even at 150–200m, uploads average around 88 Mbps, which is more than ample for most use cases.
How Does G.fast Compare to nbn Right Now?
The Australian broadband landscape has shifted significantly since our last article. In September 2025, nbn Co restructured its speed tiers for FTTP and HFC customers, bumping the old nbn 100 plans up to 500 Mbps and introducing a 2,000 Mbps “Hyperfast” tier.
However, those upgrades only apply to FTTP and HFC connections. If your premises is served by nbn FTTC or FTTN, as many Canberra homes are, you’re still capped at 100/40 Mbps, regardless of what plan you’re on.
For those premises, G.fast on the Vision Network represents a transformative upgrade:
| G.fast (Avg) | G.fast (<100m) | nbn FTTC/FTTN (Max) | |
|---|---|---|---|
| Download | 694 Mbps | 962 Mbps | 100 Mbps |
| Upload | 90 Mbps | 106 Mbps | 40 Mbps |
The average G.fast connection delivers nearly seven times the maximum speed available on nbn FTTC. For premises with short drops, the difference approaches ten times.
The Future: nbn Fibre Upgrades and What They Mean for You
nbn Co has announced plans to upgrade Canberra FTTN premises to full fibre (FTTP), with construction starting in Narrabundah and Symonston in early 2026 and a broader rollout expected over the next five years. They’ve also flagged that FTTC premises may become eligible for free FTTP upgrades from mid-2026.
We welcome this upgrade. We recommend all Canberrans upgrade to full fibre with nbn when it becomes available at their address to gain access to multigig speeds of up to 2,000 Mbps. Full fibre is the gold standard and having it available to more Canberra homes is a great outcome for the city.
As customers are upgraded, we can assist through the whole process, helping you understand your options, transition your services and make sure you’re getting the best value.
That said, the nbn fibre rollout will take time and the Vision Network will remain an alternative for customers who are looking for value. With nbn plan prices subject to CPI increases each year, G.fast on the Vision Network gives Canberra customers a choice and competition is always a good thing for consumers.
What Affects Your Speed Beyond Drop Length?
While drop length is the dominant factor, several other variables influence your G.fast sync speed:
Internal wiring quality
Old or degraded wiring between the first socket and the NTU (Network Termination Unit) can introduce noise and reduce performance. If you’re getting lower speeds than expected for your drop length, internal wiring is the first thing to investigate.
Environmental and electrical interference
G.fast operates at frequencies up to 212 MHz, which makes it sensitive to electromagnetic interference from a range of sources. We have observed that solar panel inverters, home battery storage systems, air conditioning units and poor electrical cabling within the premises can all impact sync speeds. In some cases, FM radio broadcast interference has also been a factor. If you notice speed drops at certain times of day (for example, when air conditioning kicks in, or during peak solar generation), electrical interference is a likely cause. Ensuring your home’s electrical wiring is in good condition and that the NTU is positioned away from inverters, switchboards and heavy electrical loads can help minimise these effects.
NTU placement
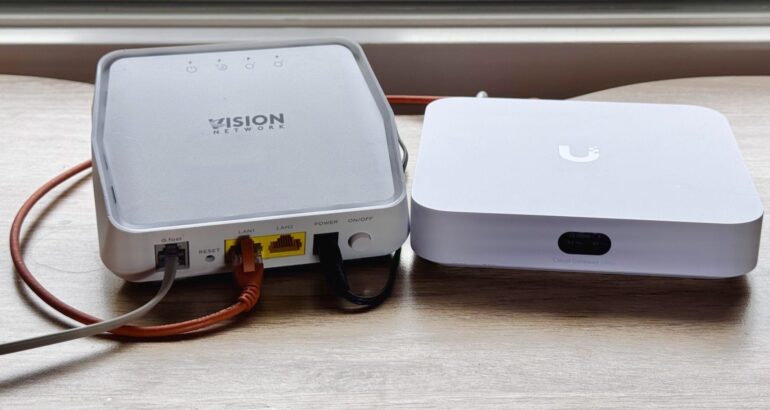
The Zyxel NTU should be connected as directly as possible to the first telephone socket. Extension cables, phone line splitters and long internal cable runs all degrade performance.
The Bottom Line
G.fast on the Vision Network continues to deliver speeds that rival or exceed nbn FTTP for a large number of Canberra homes and it’s available right now without waiting for a fibre upgrade.
Our expanded dataset across 57 suburbs confirms what our original article suggested: if your copper drop is short, expect near-gigabit speeds. If it’s longer, expect performance that still comfortably outpaces what most Australians get from their nbn connection. Almost two-thirds of observed connections sync above 500 Mbps and virtually every connection exceeds 250 Mbps.
The data also confirms that G.fast performance is holding steady as the service matures. The averages we see today closely match what we reported in 2024, now validated across a much larger sample.
If you’re in one of the Vision Network’s coverage suburbs and want to know what G.fast could deliver at your address, we can check your estimated drop length and give you a realistic speed indication before you commit. We’ve been connecting Canberra to G.fast since day one and with this much data behind us, we’re well placed to set the right expectations.
Ready to check your address? Contact us or view our G.fast plans or if you’re looking for nbn FTTP check out our nbn plans up to 2Gbit.
Get $20/month off all new G.fast connections for the first 6 months.
In Summary
Our G.fast network delivers reliable, high-speed internet across a variety of suburbs, with average speeds meeting or exceeding expectations. While infrastructure quality and cable drop lengths influence sync speeds, customers across all areas can expect fast, dependable connections much faster than nbn fibre to the node alternatives.
If you want to know more about our G.fast plans or how they could benefit your premises, contact the Infinite Networks team today.
Stay informed with the future of internet connectivity — G.fast by Infinite Networks.
Default Title